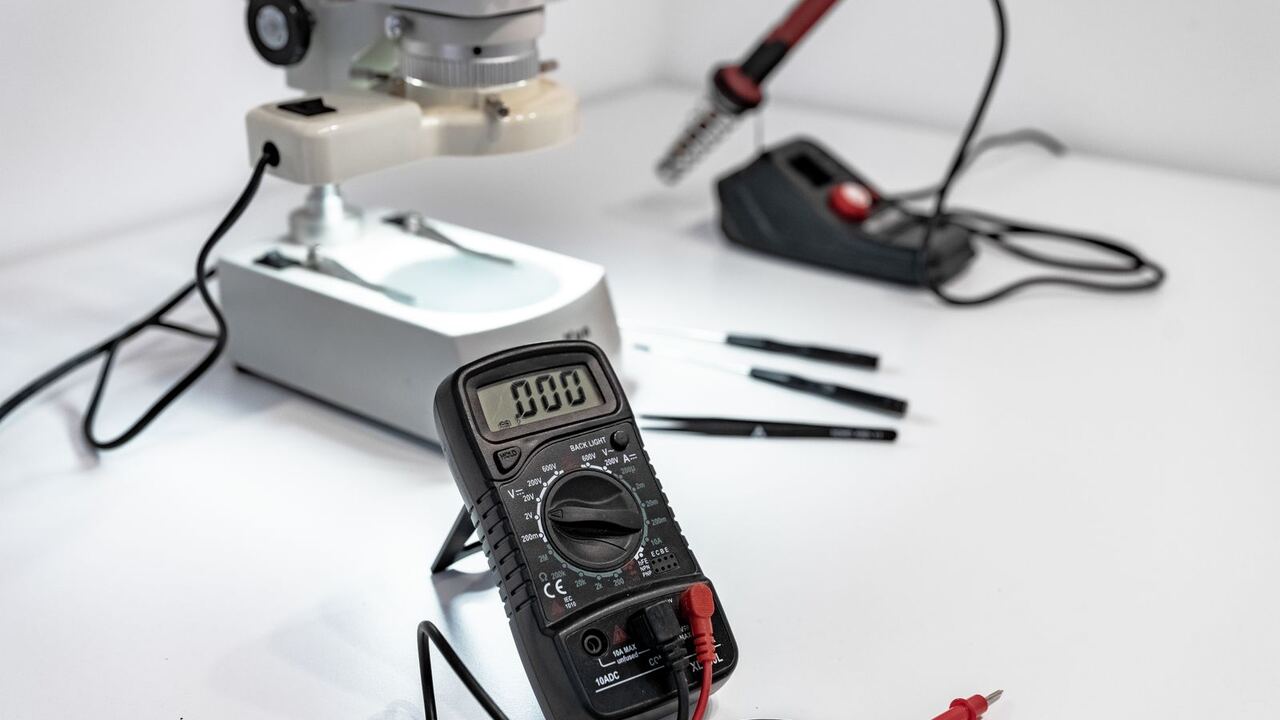
The battery system display shows 62 percent. That number appears to be a measurement result, but it is not. There is no tool that can attach to a lithium cell and read its remaining energy. What can be measured are only voltage, current, and temperature. The percentage on the display is the calculation of the BMS (Battery Management System) based on those three figures.
Understanding how the BMS estimates helps you read that number accurately, especially for LFP (lithium iron phosphate) batteries, which are now widely used for BESS.
Three Tasks of BMS
The chapter on energy storage system management in the Energy Storage Handbook published by the U.S. Department of Energy, written by researchers from Sandia National Laboratories, divides the tasks of storage device management into three groups: ensuring safe operation, monitoring and assessing conditions, and specific functions per technology.
The safety task is the easiest to understand. The BMS disconnects the battery module if the voltage, current, or temperature limits are exceeded. This prevents overcharging, over-discharging, and overheating.
The limits come from the cell specification sheet. For example, the specification for the HITHIUM 280 Ah LFP energy storage cell states:
| Parameter | Value in Specification |
|---|---|
| Typical Voltage | 3.2 V |
| Upper Charging Limit | 3.65 V |
| Lower Discharging Limit | 2.5 V (above 0 degrees Celsius) |
| Charging Temperature | 0 to 60 degrees Celsius |
| Operating SoC Window | 10 to 90 percent |
| Storage | maximum 35 degrees Celsius, SoC 20 to 50 percent |
| Cycling Life | minimum 7,500 cycles to 70 percent remaining capacity, tested at 25 degrees Celsius |
Note the last line. The figure of 7,500 cycles applies to the test temperature of 25 degrees. The hot battery space in Indonesia is clearly not the same as that condition.
Why SoC in LFP is Difficult to Estimate
The simplest way to estimate the remaining charge (SoC, state of charge) is to read the voltage. For LFP, this method is nearly futile. Its voltage curve is almost flat from about 20 to 95 percent SoC, according to a paper by Shi et al. in the journal Energy and AI (2026). Within such a wide range, the cell voltage hardly changes even though its content decreases significantly.
The second problem is hysteresis. The same voltage can mean different contents, depending on whether the battery has just been charged or discharged. In the test cells of that paper, a voltage of 3.3 V could mean about 28 percent, 51 percent, or 74 percent SoC.
The second method is to calculate the current in and out over time (coulomb counting). The same paper notes two weaknesses. Errors at the starting point are never corrected, and small differences in current sensors and capacity estimates continue to accumulate. Therefore, a good BMS combines both methods; the paper itself integrates them with a Kalman filter. The easiest corrections occur outside the flat region, near full or near empty, because there the voltage changes clearly again.
The practical consequence: a system that has been used for months only in the middle of the SoC window, without ever touching the upper end, can display increasingly inaccurate percentages.
Cell Balancing
Cells in a rack are never truly identical. The Sandia handbook notes that unbalanced cell voltages increase the risk of overcharging and over-discharging, as a weak cell can reach its limits first.
There are two ways to balance. The passive method discharges excess charge from the highest voltage cell through a resistor after the rack is fully charged. This method is cheap but wasteful, adds heat, and does not help the low-voltage cells. The active method transfers charge from high-voltage cells to low-voltage cells. The result is more efficient and cooler, but the components are more expensive and the control is more complex.
Questions to Ask Suppliers
IEEE published IEEE Std 2686-2024, recommended practices for BMS in stationary energy storage, on February 7, 2025. It includes BMS functions for various types of batteries, hardware and software architecture, and communication structure. This document can serve as a reference when you formulate the following questions:
- How does the BMS estimate SoC, and when does it self-correct?
- Is its balancing passive or active, and what is the current?
- At what temperature does the BMS limit or stop charging?
- What data does the BMS send to the inverter (PCS) and the energy management system?
The fourth item is important. According to the Sandia handbook, SoC data, health status, and cell temperature from the BMS are materials for the energy management system to calculate charge or discharge commands. If its SoC estimate is off, the entire operational schedule will also be off. The same goes for the economic calculations discussed in the five economic assumptions of BESS.
References
- Nguyen, T., Byrne, R., Rosewater, D., and Trevizan, R. Energy Storage Management Systems, Chapter 15, U.S. DOE Energy Storage Handbook, Sandia National Laboratories. https://www.sandia.gov/app/uploads/sites/163/2023/01/ESHB2020_Ch15_ESMS_Nguyen.pdf
- Sandia National Laboratories (August 20, 2025). IEEE Standard on Battery Management Systems published (IEEE Std 2686-2024). https://www.sandia.gov/ess/2025/08/20/ieee-standard-on-battery-management-systems-published
- Shi, J., Jiang, S., Tao, S., Lee, J., Borah, M., and Moura, S. (2026). An adaptive estimation approach based on fisher information to overcome the flat voltage plateau challenges of SOC estimation in LFP batteries, Energy and AI 24, 100693. https://doi.org/10.1016/j.egyai.2026.100693
- Xiamen HITHIUM New Energy. LFP71173207/280Ah LiFePO4 Cell Product Specification. https://cdn.shopify.com/s/files/1/0603/8283/8841/files/HITHIUM_280Ah_LiFePO4_Cell_Product_Specification.pdf