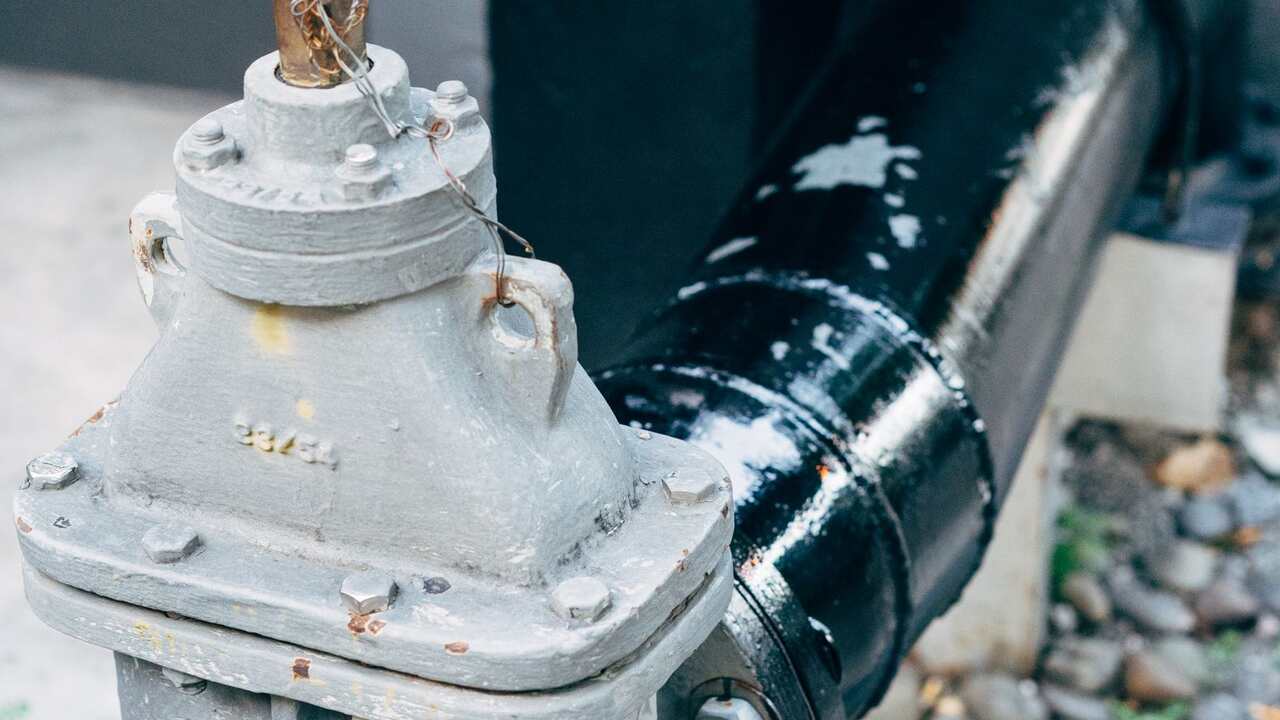
The head figure on the pump nameplate is not the height that water will definitely reach in your installation. Some is lost along the way, eroded by pipe wall friction, bends, and valves. This loss is called head loss, and its magnitude can be calculated before the pump is purchased, rather than guessed after the water fails to reach its destination.
The head required by the system, not what is written on the pump
The Hydraulic Institute divides the requirements of a pumping system into two. Static head is the difference in height of the water surface plus the pressure difference between the source and destination. This figure remains constant, regardless of the flow rate. Friction head is the loss along the pipe (major loss) plus the losses in fittings and valves (minor loss). Both are summed up:
H system = height difference + pressure difference + (f × L/D + ΣK) × v²/2g
f is the pipe friction factor, L is the length of the pipe, D is the internal diameter, K is the coefficient for each fitting, and v is the water velocity. The pump operating point falls at the intersection of the pump curve with this system curve. In centrifugal pumps, greater than expected losses shift that point, and the flow rate decreases as well.
Friction increases with the square of the velocity
An example calculation from the Hydraulic Institute uses a 4-inch pipe that is 382.5 m long with a height difference of 80.77 m. The friction portion can be read directly from the system curve table:
| Flow Rate (m³/hour) | System Head (m) | Friction Portion (m) |
|---|---|---|
| 22.7 | 83.21 | 2.44 |
| 45.4 | 90.22 | 9.45 |
| 68.1 | 102.11 | 21.34 |
When the flow rate doubles, the friction nearly quadruples. When the flow rate triples, the friction nearly increases ninefold. Therefore, a pump suitable for a small flow rate can be overwhelmed as the water demand increases slightly.
One valve is equivalent to ten meters of pipe
The loss from fittings is easier to visualize when converted to an equivalent length of straight pipe (K × D / f). Using the K values from the same example, a friction factor of 0.02, and an internal diameter of 102.26 mm:
| Component | K | Equivalent Straight Pipe |
|---|---|---|
| Swing check valve | 2.0 | ±10.2 m |
| Sudden expansion | 1.0 | ±5.1 m |
| Standard flange elbow | 0.31 | ±1.6 m |
| Gate valve (wedge disc) | 0.17 | ±0.9 m |
In long pipes, fittings contribute only a small portion. In short pipes, the story is reversed: 10 m of 4-inch pipe contributes only f × L/D of about 1.96, while the four components above contribute 3.79. The fittings are nearly twice as wasteful as the pipe itself.
Treat the K values as estimates. The Hydraulic Institute notes a wide distribution: flange elbows can vary by ±35 percent, and flange check valves can vary between minus 80 and plus 200 percent. Threaded fittings generally have higher K values than flange fittings, and K decreases as the size increases.
Pipe diameter works with the fifth power
A tip sheet from the U.S. Department of Energy (DOE) states that the cost of electricity to overcome friction is proportional to the cube of the flow rate and inversely proportional to the fifth power of the internal diameter. For example, water at 600 gpm (approximately 136 m³/hour) flowing continuously through a 10,000-foot (approximately 3 km) pipe. The annual friction cost according to DOE charts: 6-inch pipe US$16,900, 8-inch pipe US$4,250, 10-inch pipe US$1,400.
The assumptions are a rate of US$0.05 per kWh, 8,760 hours per year, and pump plus motor efficiency of 70 percent. Thus, what is worth noting is the comparison: increasing one size reduces friction costs by three to four times. The DOE also notes that epoxy-coated steel pipes or plastic pipes can reduce the friction factor by more than 40 percent.
Check this before blaming the pump
- Calculate the static head first. Closed circulation systems like cooling water loads are almost entirely friction. Open systems that lift water to high places, such as mine dewatering, are often dominated by static head and have a gentle curve. Increasing the pipe size there only reduces the already small friction portion.
- List all fittings and valves, then sum their K values. In the previous example, the check valve and sudden expansion contributed the most.
- Calculate the water velocity. Since losses are proportional to the square of the velocity, larger pipes are most effective in systems dominated by friction.
- Add a safety margin for roughness. Pipe roughness increases with age, and for commercial installations, the Hydraulic Institute recommends adding 15 percent to the roughness values in its tables.
This pump calculation is also discussed in the oil and gas process simulation class, where the pump is one of the units in the model. If you prefer to see the explanation directly, there's a clip. An overview of the process modeling is available in oil and gas process simulation in HYSYS.
Sources
- Hydraulic Institute, HI Data Tool: System Curves (updated July 19, 2024)
- Hydraulic Institute, HI Data Tool: Pipe Frictional Losses
- Hydraulic Institute, HI Data Tool: Frictional Losses in Valves, Fittings, and Bends
- U.S. Department of Energy, Reduce Pumping Costs through Optimum Pipe Sizing, Pumping Systems Tip Sheet #9 (October 2005)
- U.S. Department of Energy and Hydraulic Institute, Improving Pumping System Performance: A Sourcebook for Industry, second edition