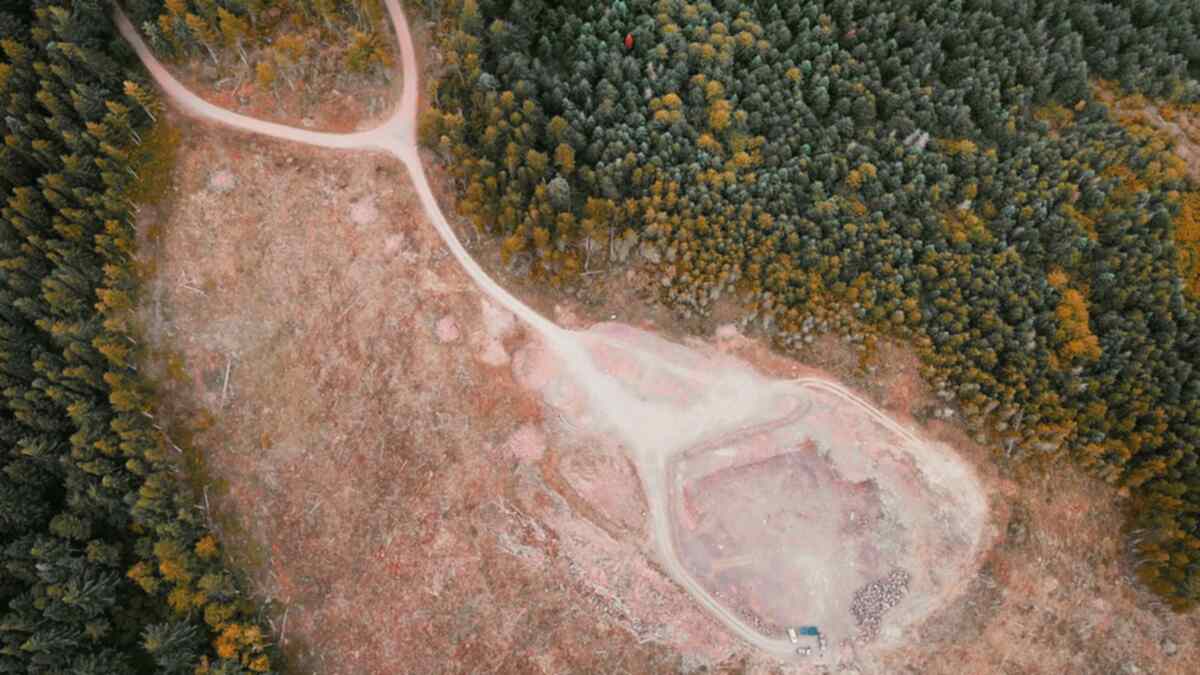
The red map on a green background looks convincing: pixels that were once forested are now bright, indicating that the forest has disappeared. In Google Earth Engine, this conclusion can be drawn in just a few lines of code, either through the difference in NDVI over two years or using the Global Forest Change dataset from the University of Maryland (Hansen et al.). The problem is that both methods measure different things, and neither directly measures deforestation.
Three terms often considered the same
| Term | Meaning | Definition Owner |
|---|---|---|
| Tree cover (tree cover) | Percentage of canopy cover by all vegetation taller than 5 meters, for the year 2000 | Hansen/UMD |
| Forest loss (forest loss) | Disturbance that replaces stands, or change from forest condition to non-forest | Hansen/UMD |
| Deforestation | Conversion of forest to other land uses; areas that are logged but expected to regrow are excluded | FAO FRA |
Global Forest Watch explains that loss includes both natural and human-induced disturbances, which can be permanent or temporary, including in timber plantations and tree plantations. The FAO, on the other hand, excludes palm oil plantations and fruit orchards from the definition of forest, even though their canopy can exceed 5 meters. Thus, a pixel of palm oil plantation may count as "tree cover" in Hansen's data, but not as "forest" according to the FAO.
Contents of the Hansen dataset in Earth Engine
The latest version in the Earth Engine catalog is UMD/hansen/global_forest_change_2025_v1_13, covering 2000 to 2025. The version 2024_v1_12 has been marked as outdated. Its resolution is 1 arc second, approximately 30 meters at the equator.
| Band | Contents |
|---|---|
treecover2000 |
Canopy cover in 2000, 0 to 100 percent |
lossyear |
0 means no loss; 1 to 25 means detected from 2001 to 2025 |
gain |
Only for the period 2000 to 2012, not updated in subsequent versions |
datamask |
0 no data, 1 land, 2 water |
Cover threshold determines the numbers
Before calculating loss, you must choose which pixels are considered forested in 2000. Global Forest Watch uses a minimum canopy cover threshold of 30 percent for most countries and 10 percent for Brazil, and users can adjust it. The FAO itself uses 10 percent. Two reports from the same dataset can differ significantly simply because of different thresholds, so always state the threshold you used.
Why annual trends cannot be read raw
User notes for this dataset state that loss from 2001 to 2012 was produced from a single processing, while subsequent years were added one by one. Version 1.13 uses Landsat 8 since 2013 and Landsat 9 since 2022, and reprocesses data starting from 2011, while the previous years have not been. Therefore, the developers request caution when comparing changes across periods, suggesting a three-year moving average, and advising that the number of pixels should not be used as a definitive area estimate. Global Forest Watch focuses its trend analysis on data after 2015.
When NDVI difference is still useful
NDVI is calculated as (NIR minus Red) divided by (NIR plus Red). In Landsat 8 and 9, this is band 5 and 4, while in Landsat 4 to 7, it is band 4 and 3. The values range from minus 1 to 1; according to NASA, rainforests fall within the range of 0.6 to 0.8, while shrubs and grasslands range from 0.2 to 0.3.
The difference in NDVI over two years is useful for small areas or periods that you define yourself. The requirements are:
- Compare the same seasons. NASA calculates vegetation anomalies against the average of the same month, not any month.
- Use composites, not a single image. Clouds and aerosols often obscure views; composites of 8, 16, or 30 days reduce this error. A single Landsat satellite revisits the same location every 16 days, and Landsat 8 and 9 alternate every 8 days.
- Be aware of saturation. NDVI saturates quickly in dense forests, so light thinning may go unnoticed. EVI is more resistant to this saturation.
- Validate the difference threshold. There is no standard NDVI difference threshold. Test first on sample points with high-resolution imagery or field checks.
Before writing "deforestation" in your report
First, determine what you want to report: lost tree cover or forest that has changed function. The former can be answered by the Hansen dataset or NDVI difference. The latter requires information on land use afterward, such as whether the area regrows or becomes a plantation, mine, or settlement. Include the dataset version, cover threshold, and period.
If you prefer to see how it works directly on the Earth Engine screen, there is a clip at taalenta.id/video/gee-begini-cara-satelit-mendeteksi-hutan-yang-hilang.
Sources
- Google Earth Engine Data Catalog: Hansen Global Forest Change v1.13 (2000-2025)
- Hansen/UMD/Google/USGS/NASA: Global Forest Change 2000-2025, User Notes v1.13
- Hansen et al. (2013), High-Resolution Global Maps of 21st-Century Forest Cover Change, Science 342: 850-853
- Global Forest Watch (WRI): 2024 Tree Cover Loss Data Explained
- Global Forest Watch (WRI): Tree Cover Data Comparison
- FAO: Global Forest Resources Assessment, Terms and Definitions
- NASA Earth Observatory: Measuring Vegetation (NDVI & EVI)
- USGS: Landsat Normalized Difference Vegetation Index
- USGS: Landsat 9